Category Archives: CentOS

Network configuration for CentOS minimal on VMware Workstation

This was a pain.

As I didn’t want to hang around too long, I downloaded the minimal ISO for CentOS.  I attempted to create a VM, but this failed when VMware tools were installing:

Installing VMware Tools, please wait...
mount: special device /dev/hda does not exist
mount: block device /dev/sr0 is write-protected, mounting read only
/etc/rc5.d/S99local: line 25: eject: command not found

I had to create a new VM without an OS, then mount the ISO as the CD drive, reboot and install that way.

Then I had to somehow configure the network.  I couldn’t install VMware tools because perl wasn’t installed, so I don’t know if that might have fixed it.

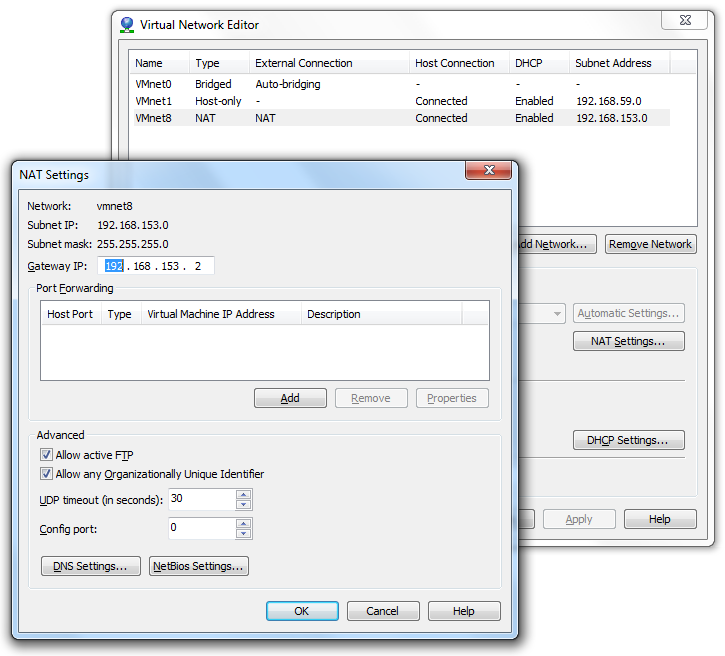
I ended up editing /etc/sysconfig/network-scripts/ifcfg-eth0, and I had to use VI because I couldn’t install nano…  An issue I had was that I didn’t know what the gateway was – I had NAT networking setup in VMware workstation.  There’s a handy tool to find out bundled with VMware Workstation.  It also works with VMware player, but doesn’t come with it.  I found it here:

C:\Program Files (x86)\VMware\VMware Workstation\vmnetcfg.exe

I selected the NAT network, then NAT settings, and this shows the gateway:

Virtual Network Editor

My /etc/sysconfig/network-scripts/ifcfg-eth0 ended as this:

DEVICE=eth0
HWADDR=00:0C:29:FC:8F:27
NM_CONTROLLED=no
ONBOOT="yes"
IPADDR=192.168.153.20
BOOTPROTO=none
NETMASK=255.255.255.0
GATEWAY=192.168.153.2
DNS1=8.8.8.8
DNS2=8.8.4.4
USERCTL=no
TYPE=Ethernet

The device, MAC and a few others were already set.  The DNS entires I have used are Google’s DNS servers.  The IP address I chose was a free one (all apart from .1 should be free, I think) on the network – select the DHCP settings for the network in the Virtual Network Editor to see the address range.  I also updated the file /etc/sysconfig/network to this:

NETWORKING=yes

That file didn’t need the gateway, as I read elsewhere.  I then restarted the network:

service network restart

I was then able to connect to the internet and install perl and then VMware tools.  It all turned out to be a complete waste of time, but ah well.

Vmware Workstation->VM (to the right of File, Edit, View)->Install VMware Tools…

yum install perl
mkdir /mnt/cdrom
mount /dev/cdrom /mnt/cdrom
cd /tmp
tar -xzf /mnt/cdrom/VMwareTools-<version>.tar.gz
cd vmware-tools-distrib
./vmware-install.pl
[hit enter a lot to accept all the defaults]

Finding out what is using IO on linux with older kernels

I’ve been wandering around the internet for hours looking for something to show which process is doing all the IO on my system, and that will run on my centos 5.3.  It has a kernel which just missed out on per process IO accounting (in /proc/PID/io) and so, most tools (iotop, etc) will not work.

Something like this:

iostat -x -m -d sdk 1

will show how much io is being used on the device (in this case sdk), but not per process.

This, in CentOS, will show some nice IO stats, but again not per process:

dstat

In later releases of CentOS, this will apparently show per process IO:

dstat -s --top-io --top-bio

I finally came accross this blog, and it worked!  However, there is a bug in the perl script which a user has reported via a comment.  I confirmed this, for my system at least, but the comments on the blog seem to have broken.  Here is a copy of the script which works for DIRTY counts:

#!/usr/bin/env perl
# This program is part of Aspersa (http://code.google.com/p/aspersa/)

=pod

=head1 NAME

iodump - Compute per-PID I/O stats for Linux when iotop/pidstat/iopp are not available.

=head1 SYNOPSIS

Prepare the system:

  dmesg -c
  /etc/init.d/klogd stop
  echo 1 > /proc/sys/vm/block_dump

Start the reporting:

  while true; do sleep 1; dmesg -c; done | perl iodump
  CTRL-C

Stop the system from dumping these messages:

  echo 0 > /proc/sys/vm/block_dump
  /etc/init.d/klogd start

=head1 AUTHOR

Baron Schwartz

=cut

use strict;
use warnings FATAL => 'all';
use English qw(-no_match_vars);
use sigtrap qw(handler finish untrapped normal-signals);

my %tasks;

my $oktorun = 1;
my $line;
while ( $oktorun && (defined ($line = <>)) ) {
   my ( $task, $pid, $activity, $where, $device );
   ( $task, $pid, $activity, $where, $device )
      = $line =~ m/(\S+)\((\d+)\): (READ|WRITE) block (\d+) on (\S+)/;
   if ( !$task ) {
      ( $task, $pid, $activity, $where, $device )
         = $line =~ m/(\S+)\((\d+)\): (dirtied) inode (\d+) \(.*?\) on (\S+)/;
   }
   if ( $task ) {
      my $s = $tasks{$pid} ||= { pid => $pid, task => $task };
      ++$s->{lc $activity};
      ++$s->{activity};
      ++$s->{devices}->{$device};
   }
}

printf("%-15s %10s %10s %10s %10s %10s %s\n",
   qw(TASK PID TOTAL READ WRITE DIRTY DEVICES));
foreach my $task (
   reverse sort { $a->{activity} <=> $b->{activity} } values %tasks
) {
   printf("%-15s %10d %10d %10d %10d %10d %s\n",
      $task->{task}, $task->{pid},
      ($task->{'activity'}  || 0),
      ($task->{'read'}      || 0),
      ($task->{'write'}     || 0),
      ($task->{'dirtied'}     || 0),
      join(', ', keys %{$task->{devices}}));
}

sub finish {
   my ( $signal ) = @_;
   if ( $oktorun ) {
      print STDERR "# Caught SIG$signal.\n";
      $oktorun = 0;
   }
   else {
      print STDERR "# Exiting on SIG$signal.\n";
      exit(1);
   }
}

Save it as ‘iodump’.  The header of the script tells you how to run it.  You have to turn on kernel messages about IO:

echo 1 > /proc/sys/vm/block_dump

and then you can run it like this:

while true; do sleep 1; dmesg -c; done | perl iodump

Don’t forget to turn off the IO logs once you’ve finished:

echo 0 > /proc/sys/vm/block_dump

I like to run it in watch a separate window (e.g. in screen):

watch -tn 1 'i=0; while (( ++i < 5 )); do sleep 1; dmesg -c; done | perl iodump'

This will keep an updated view of the output, updating every 5 seconds.